About JConsole: Java JConsole is a GUI based monitoring tool that was first introduced and bundled with JDK-1.5 and now comes with all the above versions of JDK. JConsole complies to the Java Management Extensions (JMX) specification. JConsole uses the extensive instrumentation of the Java Virtual Machine (JVM) to provide information about the performance and resource consumption of applications running on the Java platform.
The jconsole monitors the process and allows you to track memory usage in all generations of the JVM Heap,Thread State and you can also enable/disable verbose gc dynamically.
Using JConsole to monitor a local application is useful for development and for creating prototypes, but is not recommended for production environments, because JConsole itself consumes significant system resources. Remote monitoring is recommended to isolate the JConsole application from the platform being monitored.
You can start JConsole by typing the following command at the command line.
> jconsole
If you want to monitor a specific application, and you know that application's process ID, then you can also start JConsole so that it connects to that application. This application must be running with the same user ID as JConsole. The command syntax to start JConsole for local monitoring of a specific application is the following.
> jconsole processID
You can determine an application's PID in the following ways:
- On UNIX or Linux systems, you can use the ps command to find the PID of the java instance that is running.
- On Windows systems, you can use the Task Manager to find the PID of java or javaw.
Setting up Remote Monitoring
To start JConsole for remote monitoring, you use the following command syntax.
> jconsole hostName:portNum
> jconsole hostName:portNum
In the command above, hostName is the name of the system running the application and portNum is the port number you specified when you enabled the JMX agent when you started the Java VM.
Setting up Secure Remote Monitoring
You can also start JConsole so that monitoring will be performed over a connection that is secured using Secure Sockets Layer (SSL).
Connecting to a JMX Agent

>jconsole -J-Djava.class.path=JAVA_HOME/lib/jconsole.jar:JAVA_HOME/lib/tools.jar:connector-path
where JAVA_HOME is the directory containing the JDK and connector-path is the directory or the jar file containing the classes not included in JDK 5.0 to be used by JConsole for connecting to a JMX agent.
Dynamic Attach
Under previous releases of the Java SE platform, applications that you wanted to monitor with JConsole needed to be started with the following option.
The jconsole interface: The jconsole interface is composed of six tabs:
Connecting to a JMX Agent

If you start jconsole with arguments specifying a JMX agent to which to connect, it will automatically start monitoring the specified JVM. You can connect to a different host at any time by choosing Connection | New Connection. and entering the necessary information.
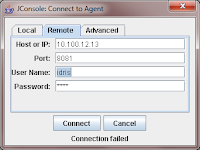
Otherwise, if you do not provide any arguments when you start jconsole, the first thing you see is the connection dialog box. This dialog box has three tabs: Local | Remote | Advanced as shown here

The advanced tab enables you to connect to other JMX agents (MBean servers) by specifying their JMX URL, and the user name and password. The syntax of a JMX URL is described in the API documentation for javax.management.remote.JMXServiceURL.
If the JMX agent is using in a connector which is not included in the JDK then, you need to add the connector classes to the classpath when running jconsole as following
At command prompt type the following
>jconsole -J-Djava.class.path=JAVA_HOME/lib/jconsole.jar:JAVA_HOME/lib/tools.jar:connector-path
where JAVA_HOME is the directory containing the JDK and connector-path is the directory or the jar file containing the classes not included in JDK 5.0 to be used by JConsole for connecting to a JMX agent.
Dynamic Attach
Under previous releases of the Java SE platform, applications that you wanted to monitor with JConsole needed to be started with the following option.
> -Dcom.sun.management.jmxremote
However, the version of JConsole provided with the Java SE 6 platform can attach to any application that supports the Attach API. In other words, any application that is started in the Java SE 6 HotSpot VM is detected automatically by JConsole, and does not need to be started using the above command-line option.
The jconsole interface: The jconsole interface is composed of six tabs:
- Summary tab: displays summary information on the JVM and monitored values.
- Memory tab: displays information on memory use.
- Threads tab: displays information on thread use.
- Classes tab: displays information on class loading
- MBeans tab: displays information on MBeans
- VM tab: displays information on the JVM

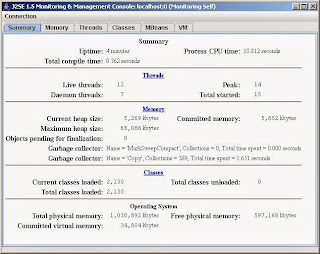
The Summary tab displays some key monitoring information on thread usage, memory consumption, class loading and information of the JVM and operating system as shown here.
For more detail information please visit to
- for JDK5 The jconsole interface
- for JDK6 jconsole management
No comments :
Post a Comment